Cloudwatch custom metrics @ Bizo
larry ogrodnek - 19 May 2011
Now that Cloudwatch Custom Metrics are live, I wanted to talk a bit about how we're using them here at Bizo. We've been heavy users of the existing metrics to track requests/machine counts/latency, etc. as seen here. We wanted to start tracking more detailed application-specific metrics and were excited to learn about the beta custom metric support.
Error Tracking
The first thing we decided to tackle tracking were application errors. We were able to do this across our applications pretty much transparently by creating a custom java.util.logging.Handler. Any application log message that crosses the specified level (typically SEVERE, or WARNING) will be logged to cloudwatch.
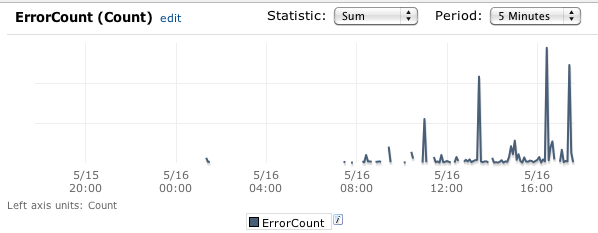
For error metrics, we use "ErrorCount" as the metric name, with the following dimensions:
- Version, e.g. 124021 (svn revision number)
- Stage, e.g. prod
- Region, e.g. us-west-1
- Application, e.g. api-web
- InstanceId, e.g. i-201345a
- class, e.g. com.sun.jersey.server.impl.application.WebApplicationImpl
- exception, e.g. com.bizo.util.sdb.RuntimeDBException
Each application has its own cloudwatch namespace. This setup allows us to track error counts and rates across our applications/versions/regions, as well as get alerts when they reach specific thresholds.
Other Application Metrics
We expose a simple MetricTracker interface in our applications:
interface MetricTracker {
  void track(String metricName, Number value, List<Dimension> dimensions);
}
The implementation handles internally buffering/aggregating the metric data, and then periodically sending batches of cloudwatch updates. This allows developers to quickly add tracking for any metric they want. Note that with cloudwatch, there's no setup required, you just start tracking.
Wishlist
It's incredibly easy to get up and running with cloudwatch, but it's not perfect. There are a couple of things I'd like to see:
- More data - CW only stores 2 weeks of data, which seems too short.
- Faster - pulling data from CW (both command line and UI) can be really slow.
- Better suport for multiple dimensions / drill down.
Cloudwatch does allow you to track against multiple dimensions, but it doesn't work as you'd probably expect. They're really treated as a single dimension. E.g. If you track against stage=prod,version=123, you can ONLY retrieve stats by querying against stage=prod,version=123. Querying against stage=prod only or version=123 only will not produce any results. You can work around this in your application, by submitting data for all permutations that you want to track against (our MetricTracker implementation works this way). It would be great if couldwatch supported this more fully, including being able to drill down/up in the UI.
Alternatives
We didn't invest too much time into exploring alternatives. It seems like running an OpenTSDB cluster, or something like statds would get you pretty far in terms of metric collection. That's only part of the story though, you would also definitely want alerting, and possible service scaling based on your metrics.
Overall Impressions
We continue to be excited about the custom metric support in Cloudwatch. We were able to get up and running very quickly with useful reports and alarms based on our own application metrics. For us, the clear advantage is that there's absolutely no setup, management or maintenance involved. Additionally, the full integration into alarms, triggers, and the AWS console is very key.
Future Use
We think that we may be able to get more efficient machine usage by triggering scaling events based on application metric data, so this is something we will continue to explore. It's easy to see how the error tracking we are doing can be integrated into a deployment system to allow for more automated rollout/rollback by tracking error rate changes based on version, so I definitely see us heading in that direction.
comments powered by Disqus